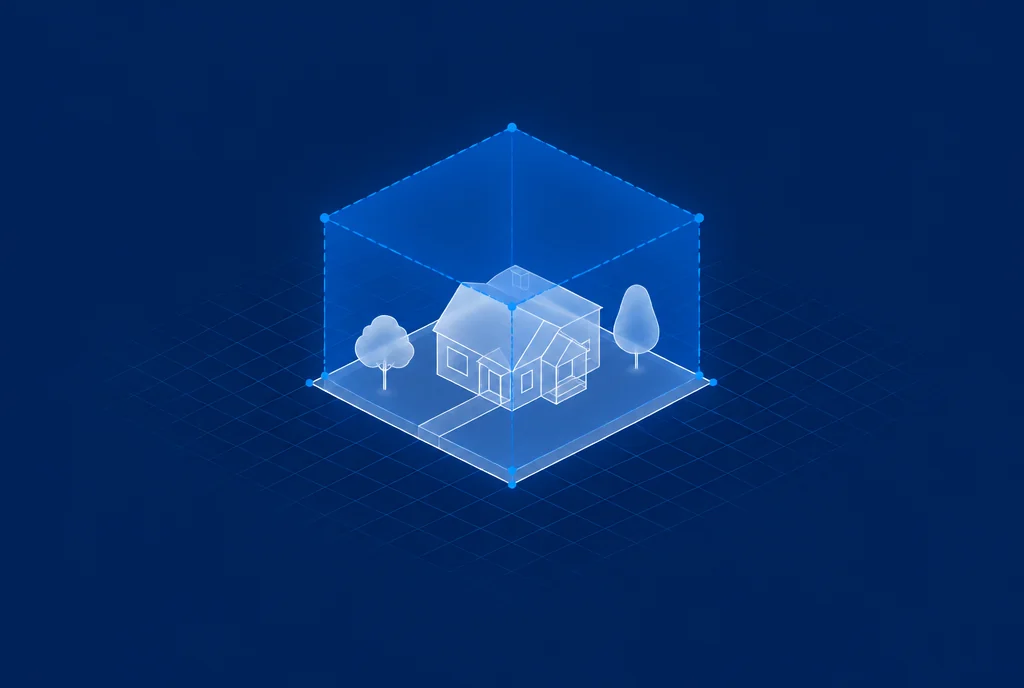
TL;DR: A Buildability Score™ is a 0-100 rating that measures how feasible it is to build on, develop, or improve a specific property. It’s calculated by a versioned, deterministic engine (current methodology: v2) that weighs nine factors — zoning standards, flood, seismic, soil, radon, wildfire, utilities, terrain, and lot geometry — from live queries to federal sources (Census, FEMA, USGS, EPA, USDA) plus parcel and zoning partners. The score replaces weeks of consultant work with a 20-second automated analysis that costs one credit instead of $2,500–$5,000.
Get your Buildability Score™ instantly — free, no signup required →
Why We Created the Buildability Score™
The Buildability Score™ is a concept we invented at Buildability™ because nothing like it existed. There was no single number — anywhere — that told you how buildable a property was. Investors were making $50K+ decisions based on gut feel and incomplete data. Homeowners were spending $5,000 on architects before knowing if their lot even supported an ADU.
Every property decision starts with the same question: can I build here, and if so, what? Before Buildability™, answering that required calling the planning department, hiring a zoning consultant ($2,500–$5,000), waiting 2-4 weeks, and still not knowing the full picture — because no single consultant checks flood zones, wildfire risk, seismic data, soil conditions, AND zoning in a single assessment.
We built the Buildability Score™ to change that. It pulls from live government APIs simultaneously and routes the reasoning to the appropriate frontier-model tier based on query complexity — all in 20 seconds. This methodology exists nowhere else. The concept, the weighting system, the regional calibration, and the data pipeline are all proprietary to Buildability™.
The Nine Factors Behind Every Score
The Buildability Score™ isn’t a black box. Methodology v2 is a weighted composite of nine measurable factors, each scored 0-100. The default national weights are published below; regional overrides shift them (more on that in a minute). A factor with no data drops out of the average entirely — nothing is estimated, and nothing is optimistically assumed.
1. Terrain (18% default weight)
What it measures: ground slope at the lot, from USGS 3DEP elevation data.
Slope is the factor that separates a parcel from its neighbors — two adjacent lots can differ by an entire foundation budget. Flat ground scores in the mid-90s; a 25% grade falls to the low 40s; a 40%+ grade is close to unbuildable on a normal budget.
2. Zoning (14% default weight)
What it measures: the dimensional standards on record — floor area ratio (FAR), maximum lot coverage, and minimum lot size.
v2 grades the standards themselves: permissive FAR and coverage score high, acre-plus minimum lots score low. And here is the honest part — when only a designation name is known, the factor is omitted. “SF-3” is a name, not an assessment.
3. Flood (14% default weight)
What it measures: FEMA flood exposure — the flood zone, Special Flood Hazard Area status, and the share of the lot inside an SFHA.
A creek clipping one corner is not the same deal as a fully mapped floodway, so v2 scores the lot fraction when the parcel boundary is available. Zone X reads ~95; a lot fully inside an SFHA falls to ~30.
4. Soil (11% default weight)
What it measures: USDA SSURGO soil survey suitability — drainage, hydric rating, and building suitability, rolled into a 0-100 sub-score upstream.
Soil also feeds the landmine layer: a soil rated “Very limited” for septic absorption fields caps the whole score (see the worked example below).
5. Wildfire (11% default weight)
What it measures: wildfire hazard potential at the location, from federal wildfire hazard mapping.
Very-high hazard pulls the factor to 35; unknown coverage drops the factor rather than guessing.
6. Utilities (11% default weight)
What it measures: proximity to power, water, and road infrastructure, from OpenStreetMap, as a 0-100 readiness sub-score.
v1 used to assume “serviceable” when data was missing. v2 refuses: unknown is a finding, not a pass — the factor is excluded.
7. Lot geometry (10% default weight)
What it measures: lot shape regularity — the parcel’s area against its bounding rectangle, computed from the real parcel ring.
A clean rectangle scores ~95; a flag lot or remnant sliver falls toward 40. Like terrain, this is a within-market factor: it distinguishes lot A from lot B on the same street.
8. Seismic (7% default weight)
What it measures: earthquake hazard level at the site, from USGS. Low hazard reads 90; very high reads 40. The weight more than doubles in California.
9. Radon (4% default weight)
What it measures: the EPA county radon zone. High-radon counties take a moderate penalty — radon is a mitigation line item, not a deal-killer, and the score treats it that way.
See your full score breakdown — nine sub-scores with plain-English explanations →
Score Ranges and What They Mean
| Score | Grade | Band | Status |
|---|---|---|---|
| 90-100 | A+ | Excellent | IC Ready — move to deeper diligence with confidence |
| 80-89 | A / A- | Excellent | IC Ready |
| 70-79 | B+ / B | Good | IC Ready — verify the conditions flagged |
| 60-69 | B- / C+ | Good | Proceed with Caution |
| 50-59 | C / C- | Moderate | Proceed with Caution — real hurdles exist |
| 30-49 | D | Moderate/Poor | High Risk — understand the constraints before spending |
| 0-29 | F | Poor | High Risk |
These thresholds are part of the published methodology — they change only with a version bump, never silently.
The score doesn’t replace deep analysis — it tells you where to spend your time. A 78 means “worth a deeper look.” A 34 means “move on to the next deal.”
What Makes This Different: Regional Intelligence
Here’s something most people don’t know: the Buildability Score™ adjusts its factor weights by state.
Why? Because building in Florida is a fundamentally different challenge than building in California or Texas. Under methodology v2:
- Florida: flood is weighted at 24% (vs. the 14% default) because flood zones dominate feasibility decisions there.
- California: terrain rises to 20% and seismic and wildfire to 16% each, because hillsides, fault zones, and WUI exposure are the constraints that actually kill projects.
- Texas: utilities are weighted at 22% (vs. 11% default) because many properties sit in unincorporated areas with no municipal services.
This means a score of 72 in Miami accounts for very different risks than a 72 in Austin or a 72 in San Francisco. The overrides are part of the published, versioned methodology — not a hidden dial.
A Real Worked Example: Strong Land, Published at 60
Here is a real address we use as the docs example — 1207 E 30th St, Austin, TX. You can re-run it on the live API today and check every number.
The land itself scores well: no part of the lot in a mapped SFHA (flood 95), low seismic (90), utilities at 95, nearly flat ground (terrain 96), a clean rectangular lot (geometry 94). A naive weighted average would land in the low 90s.
The published score is 60 · C+ · Proceed with Caution.
Why? USDA rates the soil “Very limited” for septic absorption fields. If the lot has no sewer service, a standard septic system likely fails there — an engineered system can cost tens of thousands more, and a failed perc test can kill a build outright. The Buildability Formula caps the score at the landmine’s level instead of letting a strong average bury the finding:
Score = min(composite, every landmine cap) — and the cap shows up as a named banner in the report, with its source cited.
That is the design philosophy in one example: the score exists to surface the thing that changes your decision, not to flatter the land.
The Data Behind the Score
The Buildability Score™ isn’t an opinion — it’s calculated from government and commercial data sources queried live when a fresh report runs (successful lookups are cached server-side for up to 7 days so repeat lookups are instant):
| Source | What It Provides |
|---|---|
| Census Bureau | Geocoding, boundaries, demographics |
| FEMA | Flood zone designation and SFHA status |
| USGS | Seismic hazard and 3DEP terrain/slope |
| EPA | Radon zones and environmental screening |
| USDA | SSURGO soil surveys and suitability ratings |
| USFS / federal hazard layers | Wildfire hazard potential |
| OpenStreetMap | Utility and road infrastructure proximity |
| Regrid | Parcel boundaries, APN, ownership |
| RentCast | Valuation and rent estimates (report context) |
| Municipal records | Zoning designations and dimensional standards |
One thing worth being precise about: the score itself is deterministic — there is no AI inside the math. The same inputs produce the same number, forever, and every methodology version is frozen once published. Frontier LLMs power the explanation layer — Geo, the agent that walks you through why a parcel scores what it does — not the scoring.
High Score vs. Low Score: What the Difference Looks Like in Practice
The score isn’t abstract — it directly changes what you do with a property. Here’s a side-by-side:
| Property A: strong score | Property B: weak score | |
|---|---|---|
| Zoning | Permissive FAR and coverage on record | Acre-minimum lot rules, standards unknown in county GIS |
| Flood | Zone X, no SFHA overlap | Large share of the lot inside Zone AE |
| Utilities | Power, water, road all mapped nearby | Nearest mapped infrastructure far away — factor drops out |
| Terrain | Near-flat grade | 25%+ slope across the buildable area |
| Lot geometry | Clean rectangle | Narrow flag lot |
| Your decision | Make the offer. Budget standard permitting. | Walk away, or price the constraints in from day one. |
This is why the score matters more than raw data. Property B might look buildable from a listing photo. The factor breakdown tells you it isn’t — before you spend a dollar.
How to Read and Interpret Your Score
When you get your Buildability Score™, don’t just look at the number — look at the factor breakdown. The total score is a screening tool, but the sub-scores tell you why.
If zoning is the lowest score — the dimensional standards on record are restrictive for what you want to build. You may need a variance, rezone, or conditional use permit — the most expensive kind of fix.
If flood, wildfire, seismic, or radon is the lowest — there are natural-hazard costs to price in. Some are manageable (radon mitigation, flood insurance); some reshape the whole build (elevation requirements in an SFHA). The report names the dataset behind each so you can verify.
If utilities is the lowest — or missing — mapped infrastructure is thin. Extending a sewer or power line can be a five-figure line item, and v2 deliberately refuses to assume serviceability when the data isn’t there.
If terrain or lot geometry is the lowest — the physical lot is the constraint: slope drives grading and foundation cost, and irregular shape eats the buildable envelope after setbacks.
If a landmine banner appears — read it first. A cap (like septic-limiting soil) is the engine telling you the average doesn’t matter until this one finding is resolved.
Pro tip: Two properties can have the same total score for completely different reasons. A 65 with strong zoning but high flood exposure is a fundamentally different opportunity than a 65 with clean hazards but steep ground. Always check the factors.
Compare buildability across properties in seconds →
Limitations (We're Transparent About What the Score Can't Do)
The Buildability Score™ is a screening tool, not a permit guarantee. It can't:
- Replace a site-specific survey or geotechnical report
- Predict how long your specific jurisdiction's permitting process will take
- Account for upcoming zoning changes that haven't been publicly recorded
- Replace legal advice for complex entitlement or variance work
One more honest note: our published Austin backtest (450 permits, public data) validated methodology v1; the current v2 engine restructures the factors and ships with engineering-calibrated weights pending its own backtest — the full test design, results, and limitations live on the Accuracy page.
What it can do is tell you in 20 seconds whether a property is worth the deeper analysis — and exactly where to focus your attention. That's the difference between spending $2,500–$5,000 on a consultant for every property and spending it only on the ones that score high enough to warrant it.
Ready to know your property's score? Try Buildability™ free — no signup required →
Related Questions
- What Is Zoning and Why Does It Matter?
- Can I Build an ADU on My Property?
- How Do Environmental Restrictions Affect Property Value?
- How Do I Find Properties Zoned for My Project Type? (coming soon)