
Risk assessment · live federal hazard data
Find the deal-killer first.
Flood, seismic, wildfire, radon, soils. Queried live from FEMA, USGS, EPA, and USDA on every fresh run, and weighted into one 0–100 score.
Free to score · No signup · Every factor cited · About 20 seconds
Five hazards, weighted by region.
Each hazard scores 0–100 from its federal source, then takes its weight. Flood counts 24% in Florida, seismic 16% in California.
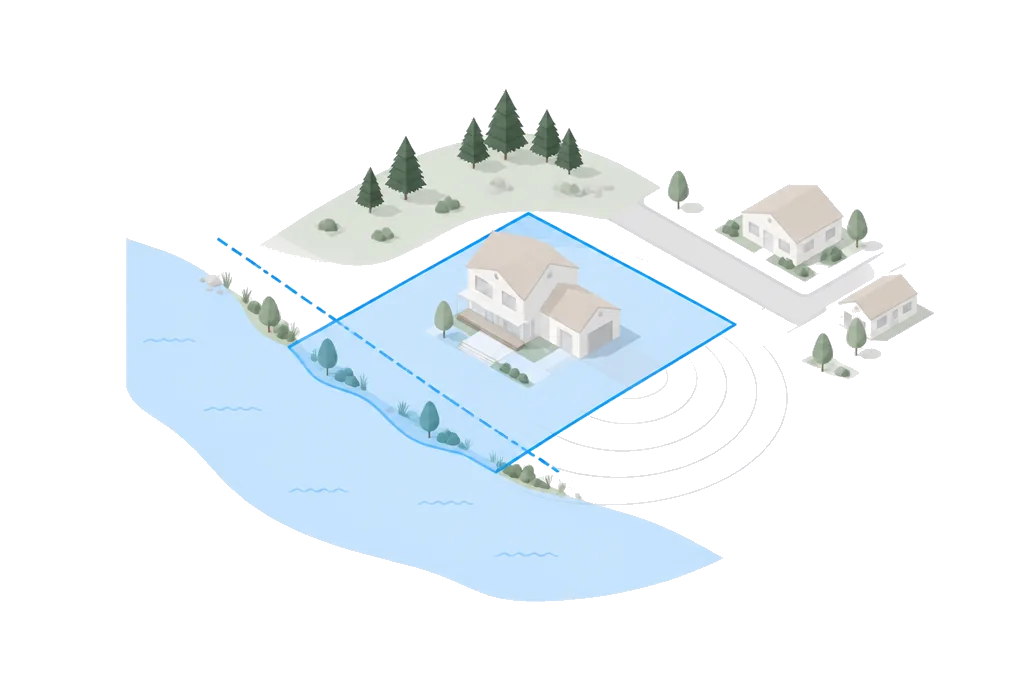
Flood zone and Special Flood Hazard Area status, including the share of the lot inside an SFHA. A mapped A/V zone drags this factor into the 30s–40s; zone X reads minimal risk.
Soil survey classification, drainage, and building suitability. A poor suitability rating is a heavy penalty.
Wildfire hazard potential around the parcel. Very high potential is a heavy hit; moderate exposure trims the factor.
Earthquake hazard level at the site. The weight rises to 16% in California.
County radon zone designation. EPA Zone 1 takes a moderate penalty: a mitigation line item, not a deal-killer.
Sample shown: engine output (methodology v2) for a Texas parcel, 89 · A · IC-ready. The same sample appears across the site.
A screen you can put in a memo.
Three properties make the hazard findings citable in front of a lender or committee.
Queried live, every fresh run
Sources are re-queried whenever a fresh report runs. Never scraped, never guessed. Successful lookups are cached for up to 7 days, so a FEMA map revision shows up the next time the parcel is re-queried.
Missing data drops out
A hazard with no data is removed from both sides of the weighted average. Nothing is estimated, imputed, or silently penalized.
Every finding cited
Each factor names the federal dataset it came from (FEMA NFHL, USGS, EPA, USDA SSURGO), so the number survives the room’s toughest skeptic.
A hazard consult, held against one report.
What a specialist memo gives you, beside a live-cited screen.
| Traditional risk assessment | With Buildability™ | |
|---|---|---|
| Time to an answer | 2–3 weeks per site | About 20 seconds |
| Cost per parcel | $2,500–$5,000 consultant memo | $99, $79 at volume |
| Sources | Assembled by hand | 5 federal agencies, queried live |
| Citations | Rarely included | Every finding names its dataset |
| Repeatability | One professional’s judgment | Same inputs, same number, forever |
A screening standard, not a substitute for a Phase I ESA or geotechnical report on the deal you pursue. Audit the sources
Before you decide.
Which risks does it cover?
Five hazard factors (flood, seismic, wildfire, radon, and soils) weighted into the Buildability Score™ alongside zoning, utilities, terrain slope (USGS 3DEP), and lot geometry.
Where does the hazard data come from?
Live federal queries on every fresh run: FEMA NFHL for flood, USGS for seismic and terrain, EPA for radon zones, USDA SSURGO for soils. Every finding cites its dataset.
What happens when a hazard is severe?
It does not average away. A Special Flood Hazard Area or very high seismic hazard pulls that factor into the 30s–40s, and regional weighting (flood 24% in Florida, seismic 16% in California) can make it dominate the verdict.
What if a factor has no data for my parcel?
It drops out of the weighted average entirely. Nothing is estimated or imputed. The report says what is missing.
Does this replace a Phase I ESA or geotech report?
No. It is a 20-second screen that tells you where diligence budget is worth spending. Commission the specialists on the site that survives it.
What does it cost?
The live Score is free: every factor, cited, no card. After that, one report ($99, sliding to $79 at volume) buys the full report.

See the hazard before you own it.
Flood, seismic, wildfire, radon, and soils, queried live and weighted into one score in about 20 seconds.
Free to score · Full report $99 · All 50 states