
The Buildability Score™ · methodology v2
One number. Published math.
Nine weighted factors, five federal agencies queried live, and a versioned formula anyone can audit. The standard for what you can build on American land.
Free to score · No card, no signup · About 20 seconds
Definition
What is the Buildability Score™?
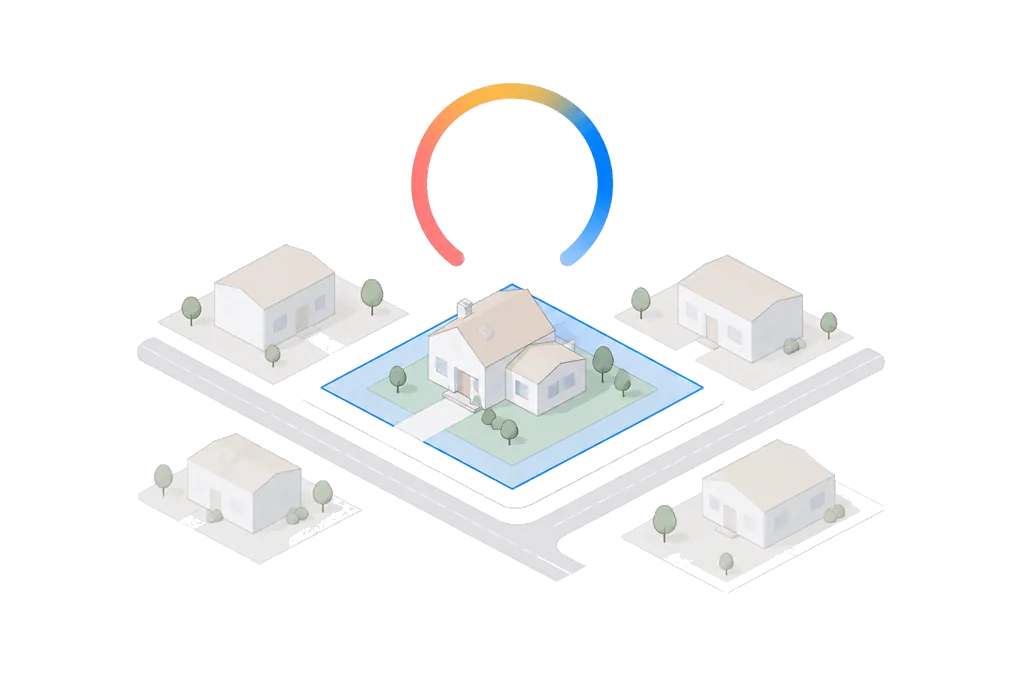
The Buildability Score™ is a 0–100 rating of development feasibility for any U.S. parcel, computed from nine weighted factors — zoning, flood, seismic, soil, radon, wildfire, utilities, terrain, and lot geometry — sourced live from five federal agencies plus parcel and zoning partners, with every finding cited to its source.
Higher scores mean easier feasibility; lower scores flag hazard, regulatory, or site constraints. A score of 70+ (grade B or better) is IC-ready. The math is a versioned, frozen weighted average (methodology v2): same inputs return the same number, forever, and any change ships as a new version rather than a silent tweak.
0 to 100, published end to end.
This figure is rendered from the engine's own labeling code. It can never drift.
Nine factors. One score.
Each factor measures a different aspect of feasibility, weighted by how much it constrains what you can build, and re-weighted by region.
Dimensional standards on record: FAR, lot coverage, minimum lot size. Omitted when only a designation name is known.
Flood zone, Special Flood Hazard Area status, and the share of the lot inside an SFHA.
Earthquake hazard level at the site.
Soil survey classification, drainage, and building suitability.
County radon zone designation.
Wildfire hazard potential around the parcel.
Proximity to power, water, and road access.
Ground slope at the lot. Slope differs house to house, so it separates neighbors.
Lot shape regularity. A long sliver builds differently than a clean rectangle.
Live engine output (methodology v2) for a Texas parcel: 89 · A · IC-ready. A factor marked “—” had no data on record and dropped out rather than being guessed. The same sample appears on the homepage.
The same lot. Four regions.
Flood carries 24% of the score in Florida. Utilities carry 22% in Texas. Seismic and terrain rise in California. One real parcel, scored under each weight set.
Heavy hits and light lifts.
A floodplain cannot be fixed by great zoning. Severe findings pull their factor deep into the red instead of averaging away.
Heavy penalties
Factor sub-score drops to the 30s–40sSome conditions dominate their factor. A mapped high-hazard flood zone or very high seismic hazard pulls that factor deep into the red, and with regional weighting it can dominate the verdict.
- FEMA Special Flood Hazard Area (A/V zones)
- Very high seismic hazard
- Very high wildfire hazard potential
- Poor soil suitability rating
- No utility access nearby
Moderate penalties
Factor sub-score in the 50s–70sThese conditions reduce feasibility without dominating it. They warrant additional diligence, mitigation, or budget.
- High radon zone (EPA Zone 1)
- Moderate seismic hazard
- Moderate wildfire exposure
- Middling soil drainage class
- Steep ground slope at the lot
Strong signals
Factor sub-score in the 85–95 rangeLow-risk findings lift the score. When a factor has no data at all, it drops out of the average. It is never estimated or silently penalized.
- FEMA zone X, minimal flood risk
- Low seismic hazard
- Low wildfire risk
- High soil suitability rating
- Utilities confirmed close by
Transparent by design.
A weighted average over the factors that have data, with weights tuned by region. No black box. The formula fits in a sentence.
Score = Σ wi × xi / Σ wi, over factors with data
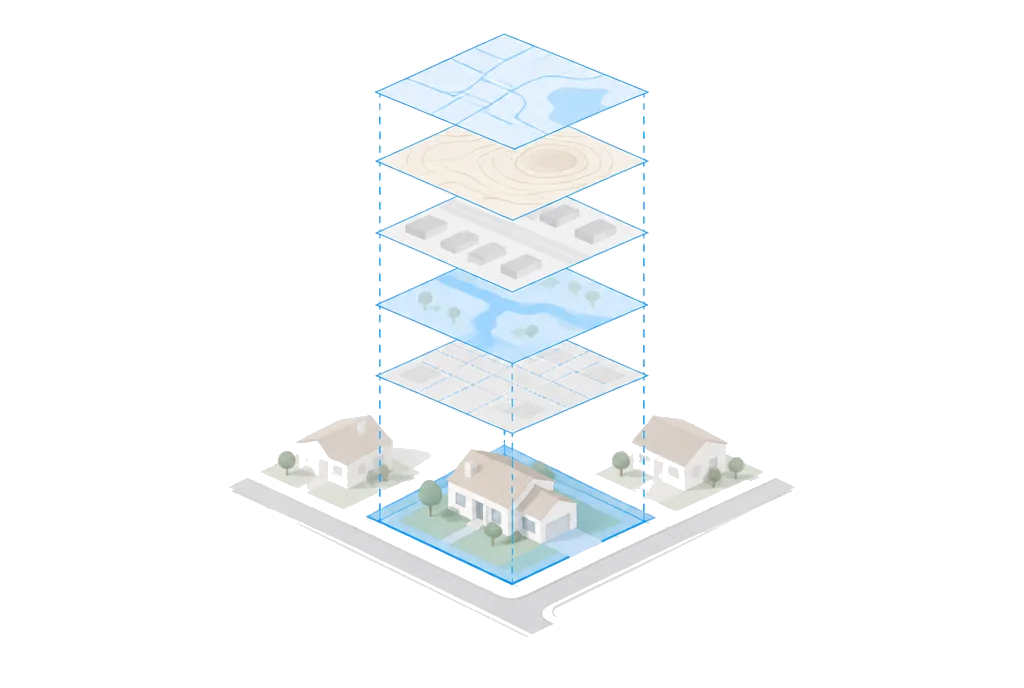
Every published methodology is a frozen artifact. The current engine is v2. The same inputs produce the same number, forever; a change to the math requires a reviewed version bump, never a silent tweak.
A set of hand-computed golden cases guards the engine. If a code change moves any expected score, the build fails. The score cannot change meaning by accident.
A factor with no data is removed from both sides of the weighted average. Nothing is estimated, imputed, or silently penalized.
Each factor carries a note naming the dataset it came from: FEMA NFHL, USGS, EPA, USDA SSURGO. Sources are queried live when a report is generated; successful lookups are cached server-side for up to 7 days so repeat lookups are instant.
No network, no clock, no randomness inside the engine. The number maps to a grade, band, and verdict through published thresholds.
A feasibility memo, held against the Score.
What a consultant memo gives you, beside a published standard.
| Traditional feasibility | The Buildability Score™ | |
|---|---|---|
| Time to results | 4–8 weeks | About 20 seconds |
| Cost | $2,500–$5,000 | One report, $99 |
| Method | Varies by consultant | Published, versioned formula |
| Repeatability | One professional's judgment | Same inputs, same number, forever |
| Data sources | Assembled by hand | 5 federal agencies, queried live |
| Citations | Rarely included | Every finding names its dataset |
The Score is a screening standard, not a replacement for entitlement counsel on the deal you pursue.
The economics
Screen the whole pipeline for the price of vetting one deal.
A consultant memo runs $2,500–$5,000 and takes weeks. Most of it is the data. This is the data, cited, in 20 seconds.
$79 each at volume. Reports never expire. The live Score stays free on every address.
No record, no charge: if the parcel record cannot be found, you are not billed.
Built for people who answer to committees.
The same standard. A different first question for each of them.
Land investors
Buying land without confirmed buildability is a six-figure gamble. Screen parcels against one standard before making offers.
Learn moreDevelopers
Weeks of feasibility research before knowing if a site is viable. Kill the bad sites in seconds; spend diligence budget on the good ones.
Learn moreLenders
Underwriting collateral without knowing its development potential. A repeatable, documented number your credit memo can cite.
Learn moreArchitects and builders
Starting design only to discover constraints that kill the concept. Understand the constraint envelope before the first sketch.
Learn moreBefore you decide.
What is the Buildability Score™?
A 0–100 feasibility score for any U.S. parcel: nine weighted factors (zoning, flood, seismic, soil, radon, wildfire, utilities, terrain, and lot geometry) rolled into one number with a grade and verdict. 70+ is IC-ready; below 50 is high risk.
How is it calculated?
A weighted average of nine sub-scores. Defaults: terrain 18%; zoning and flood 14%; soil, wildfire, and utilities 11%; lot geometry 10%; seismic 7%; radon 4%. Regional overrides apply (Florida floods at 24%, Texas utilities at 22%) and missing data drops out entirely.
Can the score change without notice?
No. Each methodology version (current: v2) is frozen and golden-tested: reference cases run in CI, and any change that moves a score fails the build. Improvements ship as a new version; historical scores reproduce exactly.
How accurate is it?
Every factor comes from live federal queries (Census, FEMA, USGS, EPA, USDA) plus parcel and zoning partners, and every finding cites its dataset. It is a screening tool, not a permit guarantee: verify locally before committing capital.
What does a high score mean?
A score of 70+ (grade B or better) is IC-ready: strong development potential with few major obstacles. 50–69 means proceed with caution; some factors need attention. Below 50 indicates significant challenges worth understanding before you spend on consultants.
How long does it take?
About 20 seconds: geocode via Census, query the sources live, run the engine, return the score with its factor breakdown. The live Score is free and unlimited; the $99 report adds the parcel record.

One standard. Any parcel.
Nine weighted factors, five federal agencies queried live. The verdict takes about 20 seconds.
Free to score · Full report $99 · All 50 states